有目的性的探索数据集以获取具体的优化方向和思路。
Intuition
探索性数据分析 (EDA) 以了解数据集的信号和细微差别。这是一个循环过程,可以在开发过程的各个阶段(标记之前/之后、预处理等)完成,具体取决于问题的定义程度。例如,如果不确定如何标记或预处理数据,可以使用 EDA 来解决这个问题。
将从 EDA 开始项目,这是一个经常被误解的重要(且有趣)的过程。以下是对 EDA 的思考:
- 不仅仅是可视化一组规定的图(相关矩阵等)。
- 目标是说服自己您拥有的数据足以完成任务。
- 使用 EDA 回答重要问题并且容易地获得洞察力。
- 不是一次性的过程;随着数据的增长,希望重新访问 EDA 来获得数据分布变化、异常等。
让使用 EDA 回答几个关键问题。
from collections import Counter
import ipywidgets as widgets
import matplotlib.pyplot as plt
import seaborn as sns
import warnings
from wordcloud import WordCloud, STOPWORDS
sns.set_theme()
warnings.filterwarnings("ignore")
标签分布
每个标签有多少个数据点?
# Distribution of tags
tags, tag_counts = zip(*Counter(df.tag.values).most_common())
plt.figure(figsize=(10, 3))
ax = sns.barplot(list(tags), list(tag_counts))
plt.title("Tag distribution", fontsize=20)
plt.xlabel("Tag", fontsize=16)
ax.set_xticklabels(tags, rotation=90, fontsize=14)
plt.ylabel("Number of projects", fontsize=16)
plt.show()
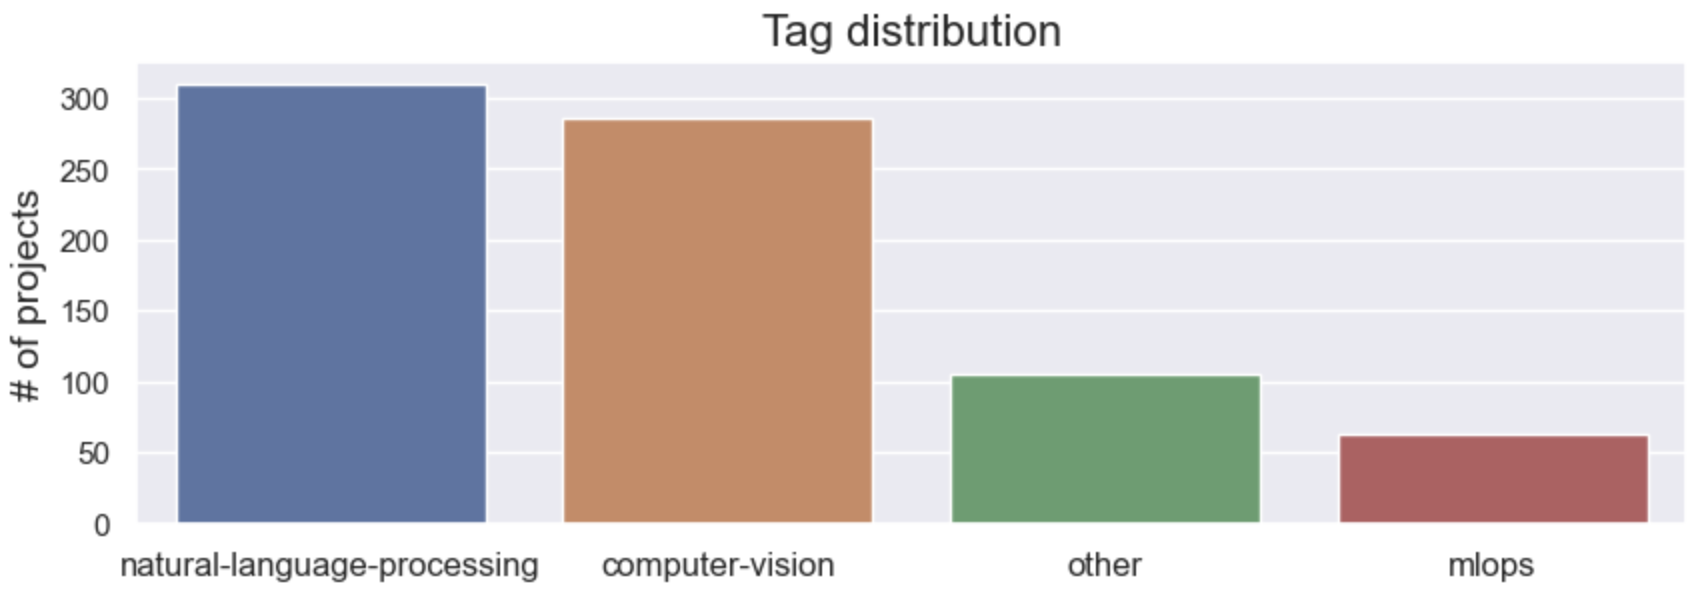
# Most common tags
tags = Counter(df.tag.values)
tags.most_common()
[('natural-language-processing', 388),
 ('computer-vision', 356),
 ('mlops', 79),
 ('reinforcement-learning', 56),
 ('graph-learning', 45),
 ('time-series', 31)]
将在拆分训练数据后和训练模型之前解决数据不平衡问题
Wordcloud
每个标签的标题和描述中是否有足够的信号?这很重要,因为想要验证最初的假设,即项目的标题和描述是极具影响力的特征。
# Most frequent tokens for each tag
@widgets.interact(tag=list(tags))
def display_word_cloud(tag="natural-language-processing"):
    # Plot word clouds top top tags
    plt.figure(figsize=(15, 5))
    subset = df[df.tag==tag]
    text = subset.title.values
    cloud = WordCloud(
        stopwords=STOPWORDS, background_color="black", collocations=False,
        width=500, height=300).generate(" ".join(text))
    plt.axis("off")
    plt.imshow(cloud)
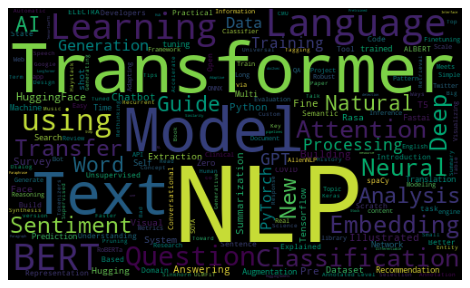
Looks like the title text feature has some good signal for the respective classes and matches our intuition. We can repeat this for the description text feature as well. This information will become useful when we decide how to use our features for modeling.
到目前为止,所做的所有工作都在 IPython note本中,但在仪表板课程中,将使用Streamlit将所有这些转移到交互式仪表板中。
更多干货,第一时间更新在以下微信公众号:

您的一点点支持,是我后续更多的创造和贡献
转载到请包括本文地址 更详细的转载事宜请参考文章如何转载/引用
本文主体源自以下链接:
@article{madewithml,
    author       = {Goku Mohandas},
    title        = { Made With ML },
    howpublished = {\url{https://madewithml.com/}},
    year         = {2022}
}